Use this guide to work through common setup and configuration questions when using the Power BI Connector. If you ever need additional support, don’t hesitate to reach out to Samsara Support. Common QuestionsDocumentation Index
Fetch the complete documentation index at: https://samsara-showcase.mintlify.app/llms.txt
Use this file to discover all available pages before exploring further.
- How do you update your Samsara API access?
- How do you reset data permissions in Power BI?
- How do you set up data refresh?
- How do you retrieve more than six months of data using Power Query?
- How do you connect data for >1 organization in Power BI?
- How do you assign field relationships in Model View?
Update your Samsara API access
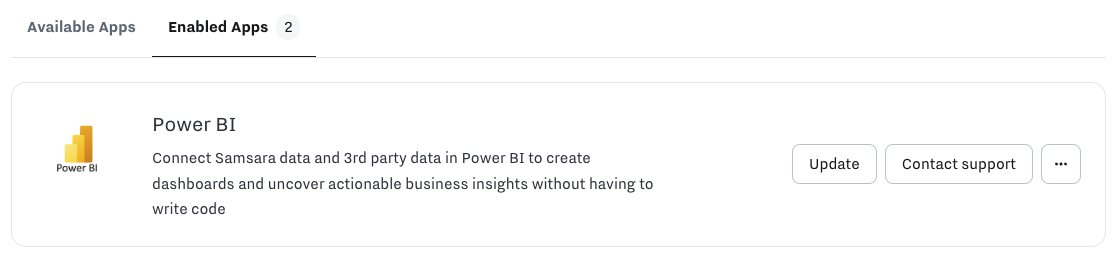
Follow our Marketplace app installation steps in the Samsara dashboard (Settings > Apps) to enable API access for Power BI.
- The API Token that is generated in the app install comes with the exact scopes required for Power BI
- If you ever need to regenerate the API token or revoke access, select the more actions menu under Settings > Apps > Enabled (additional guidance here)
Reset data permissions in Power BI
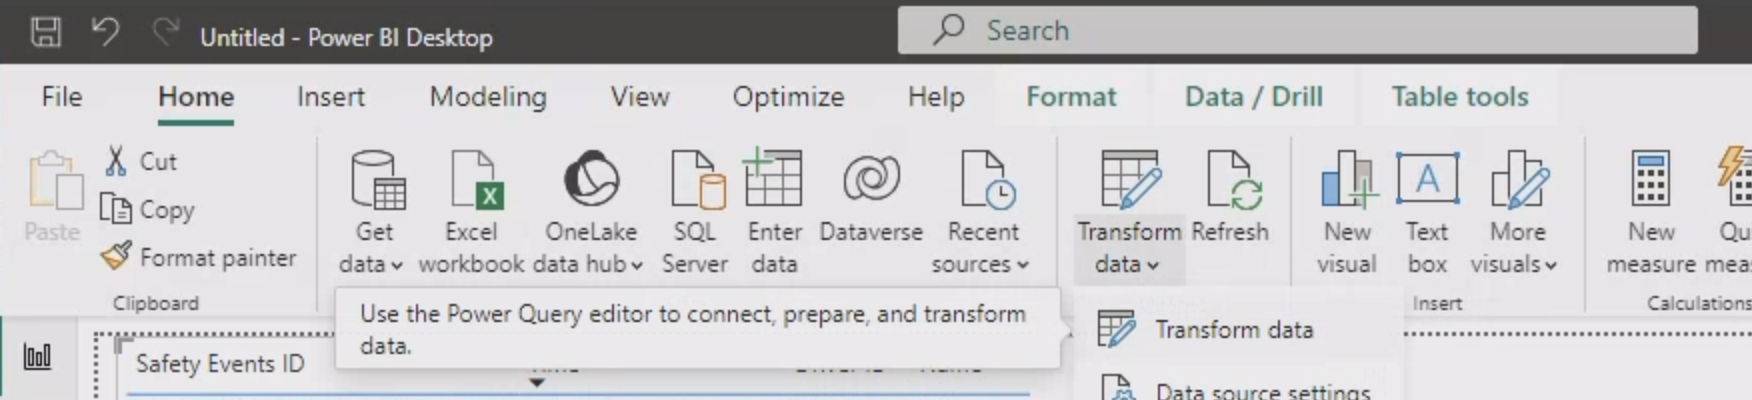
If you need to update the Samsara API token for the Power BI Connector, navigate to File > Options and settings then select Data sources settings. Select “Samsara”. You have the option to edit or clear permissions for this data source. Note: you can also access “Data source settings” from Home > “Transform data”.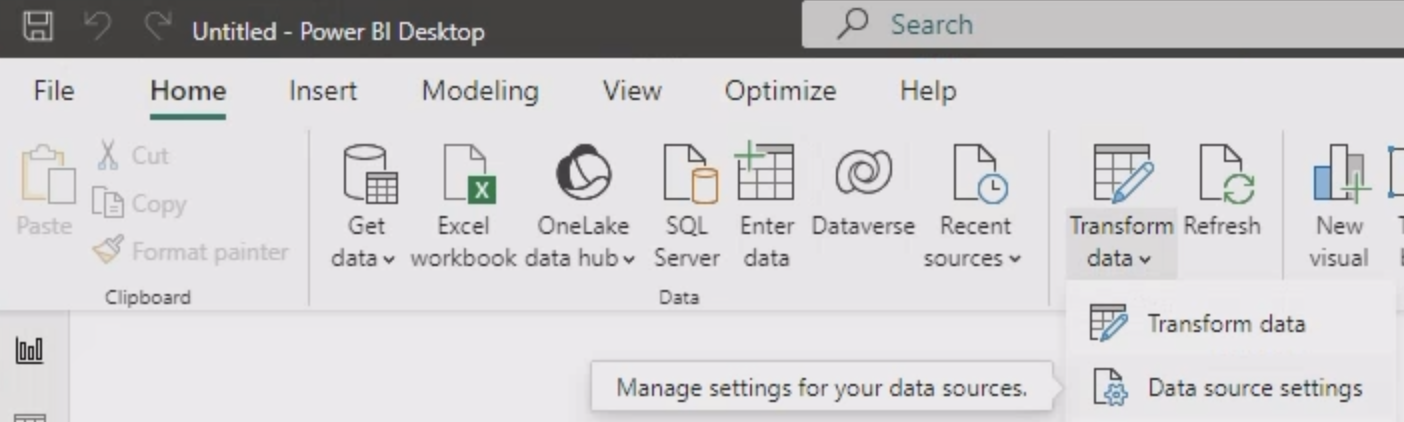
Setting up Data Refresh
Recommend consulting Microsoft’s comprehensive guide on data refresh in Power BI.
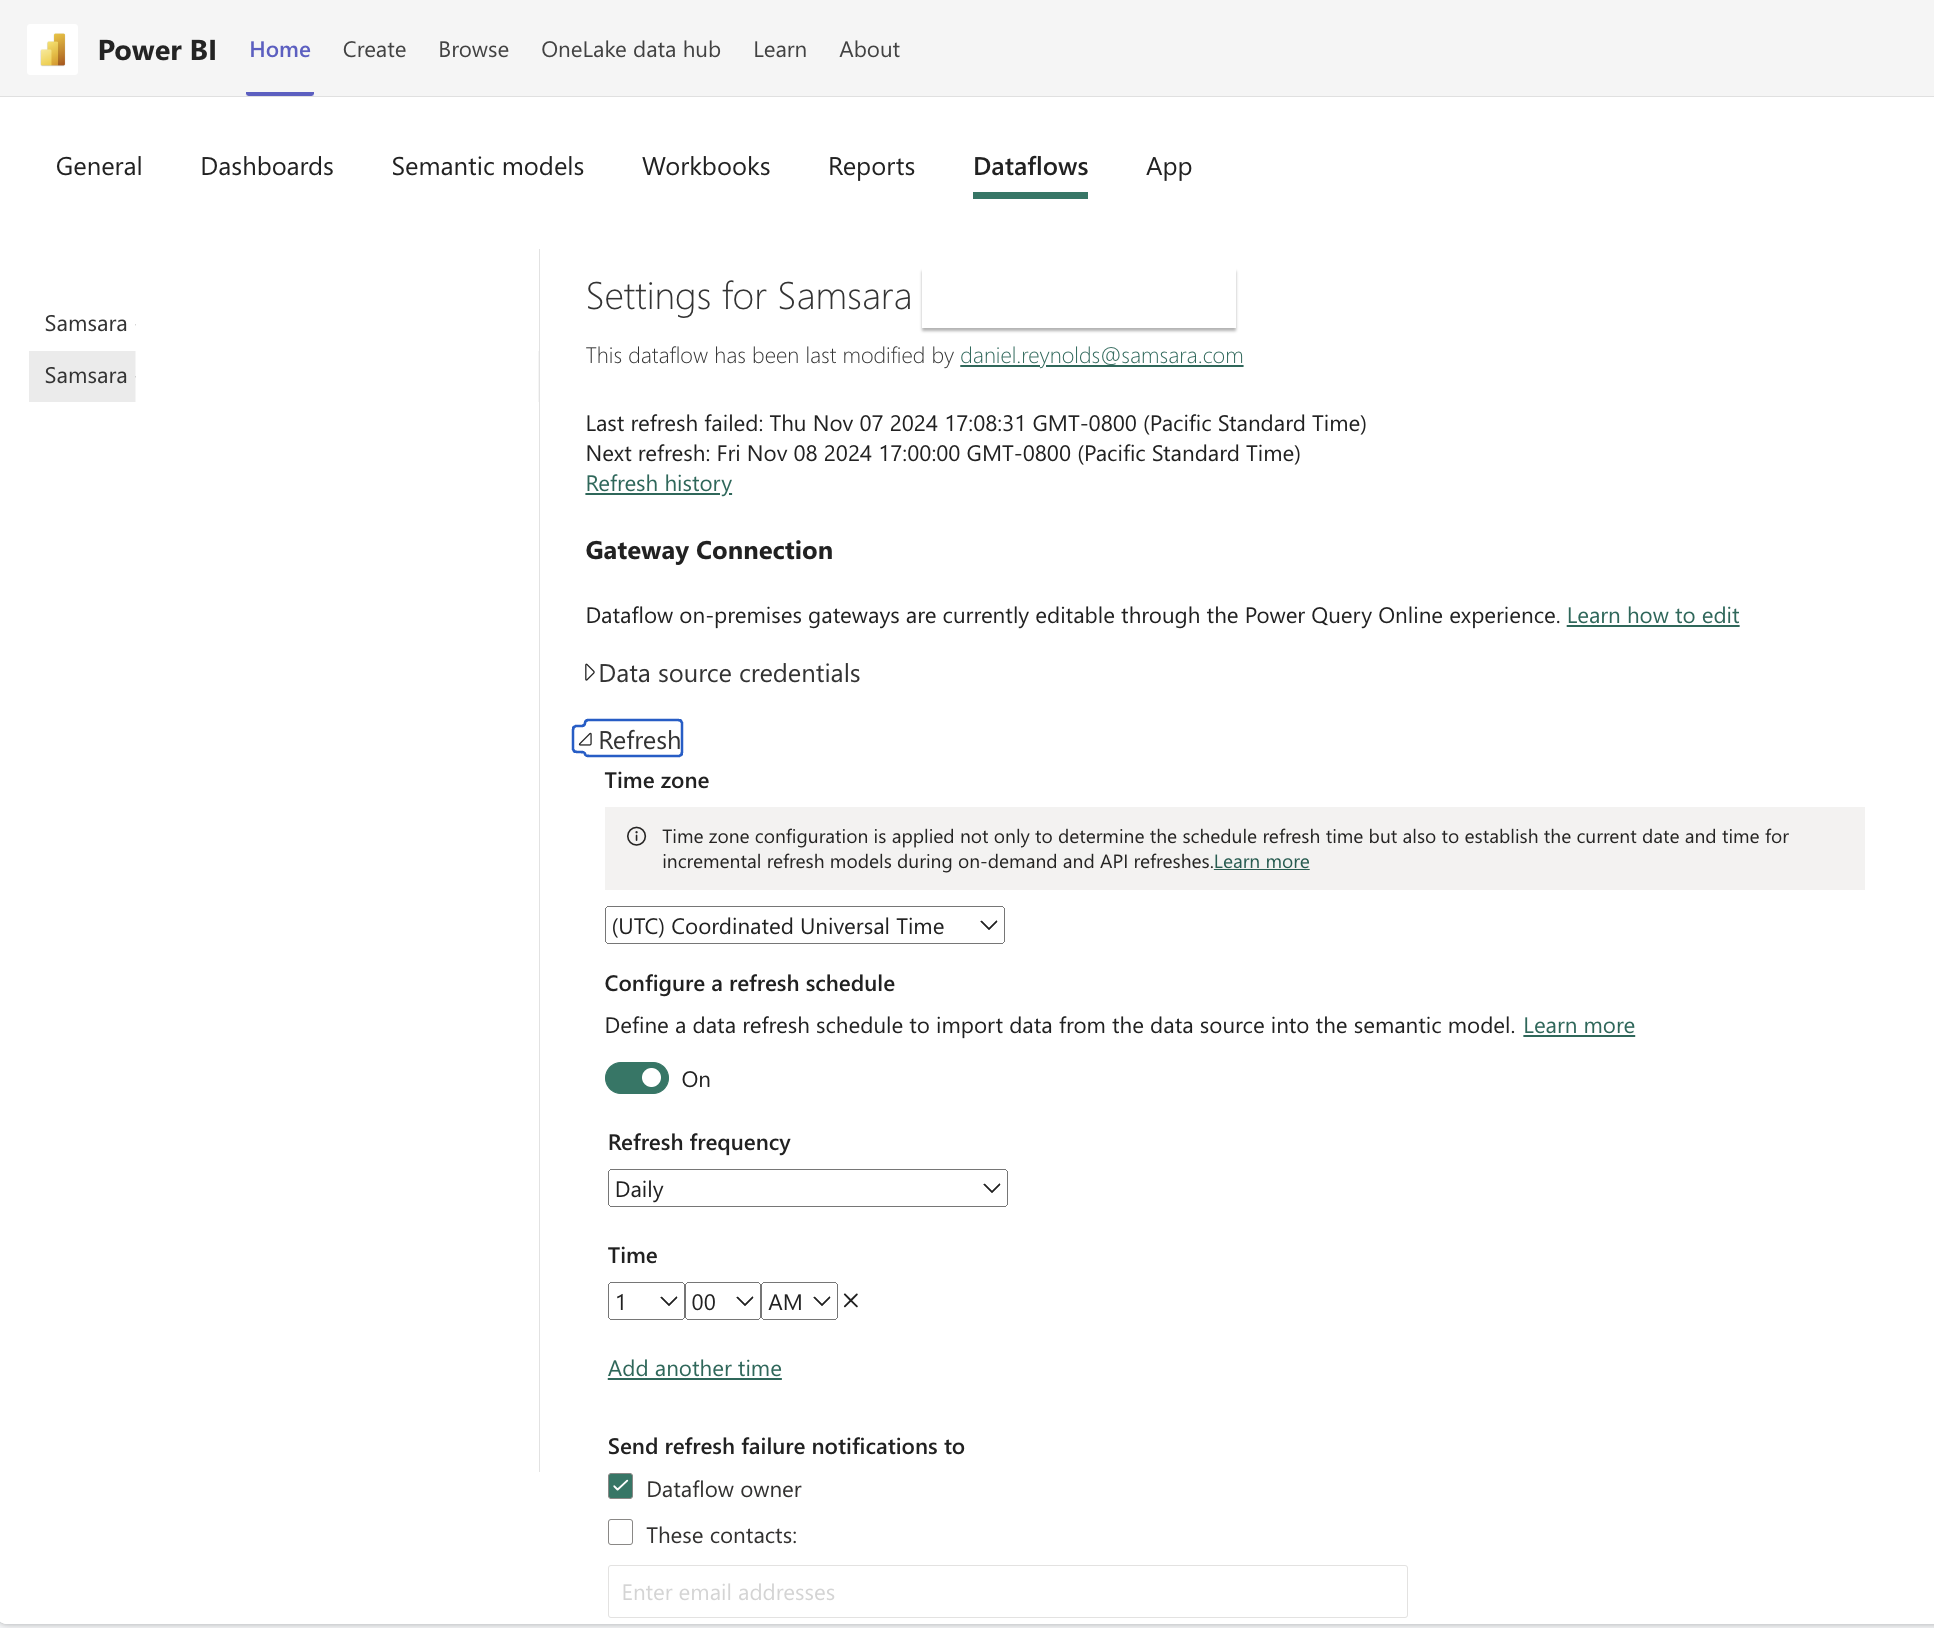 Dataflows also support incremental refresh if using a Microsoft workspace in
 Premium capacity. Incremental refresh keeps tables current without loading the entire data set every time (unlike how manual or scheduled refreshes work) and can aggregate a dataset over multiple years.
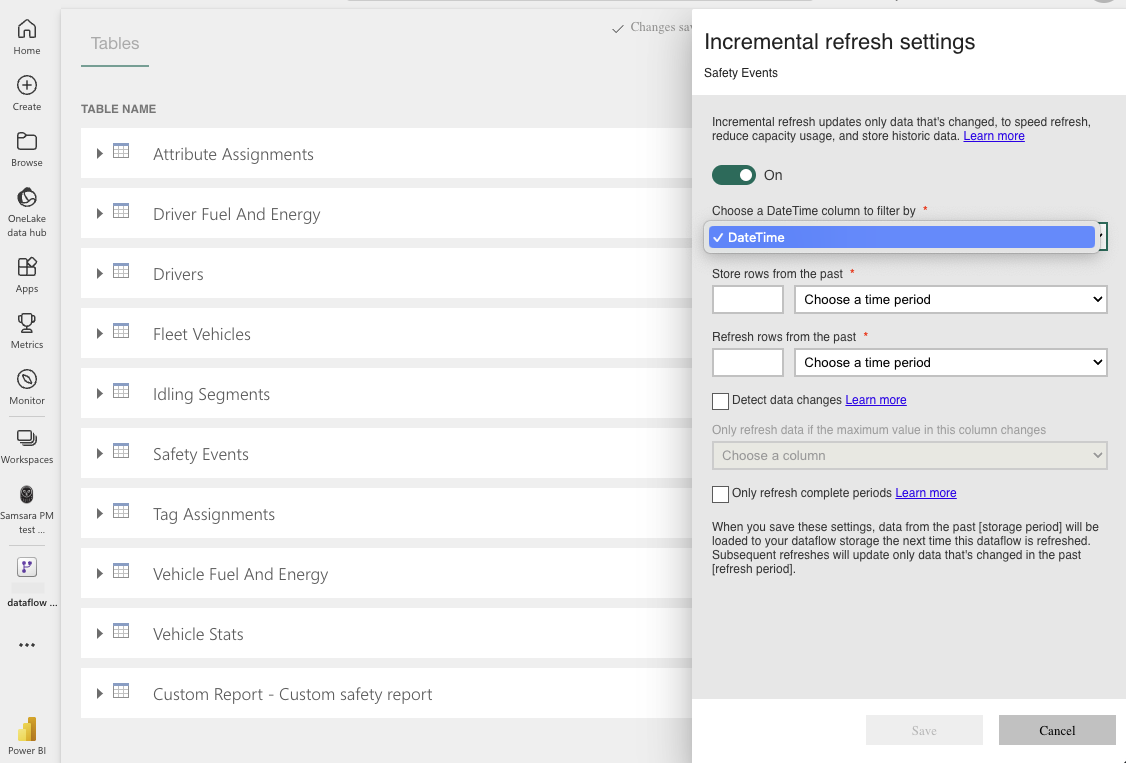
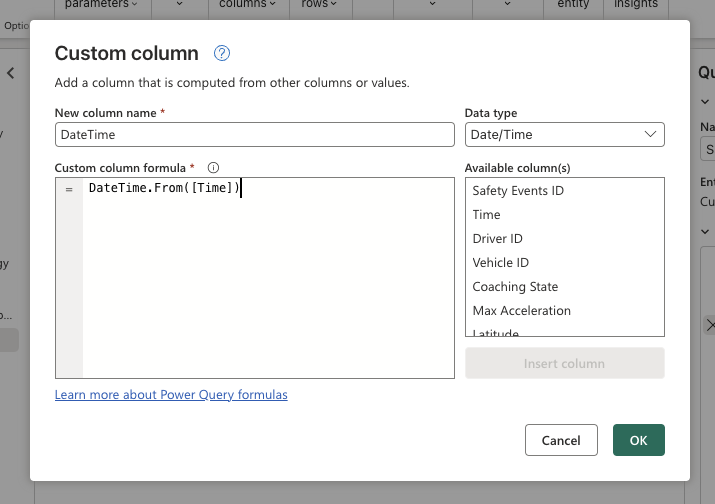
- You will need a DateTime column for incremental refresh. If your table as a timestamp value, you can easily add a custom column for DateTime using the formula
=DateTime.From([column_name])
Retrieve more than six months of data using Power Query
The connector is designed to return up to 6 months of data at a time. This limit is designed to ensure table load performance. However, there is no limit to what window of data you can query. In other words, you can request data as far back as you’ve been a customer of Samsara. Example: retrieve 12 months of Safety Event dataGet data twice for 6-month windows
Using Power BI Desktop and a direct connection, select Get data, select Samsara and the desired table.To get data for 12 months I will repeat this process twice, first selecting January 1 to June 30, then July 1 to December 31.Once the second table has loaded you will see two instances in your Data panel on the right side of the report builder: “Safety Events” and “Safety Events (2)”.
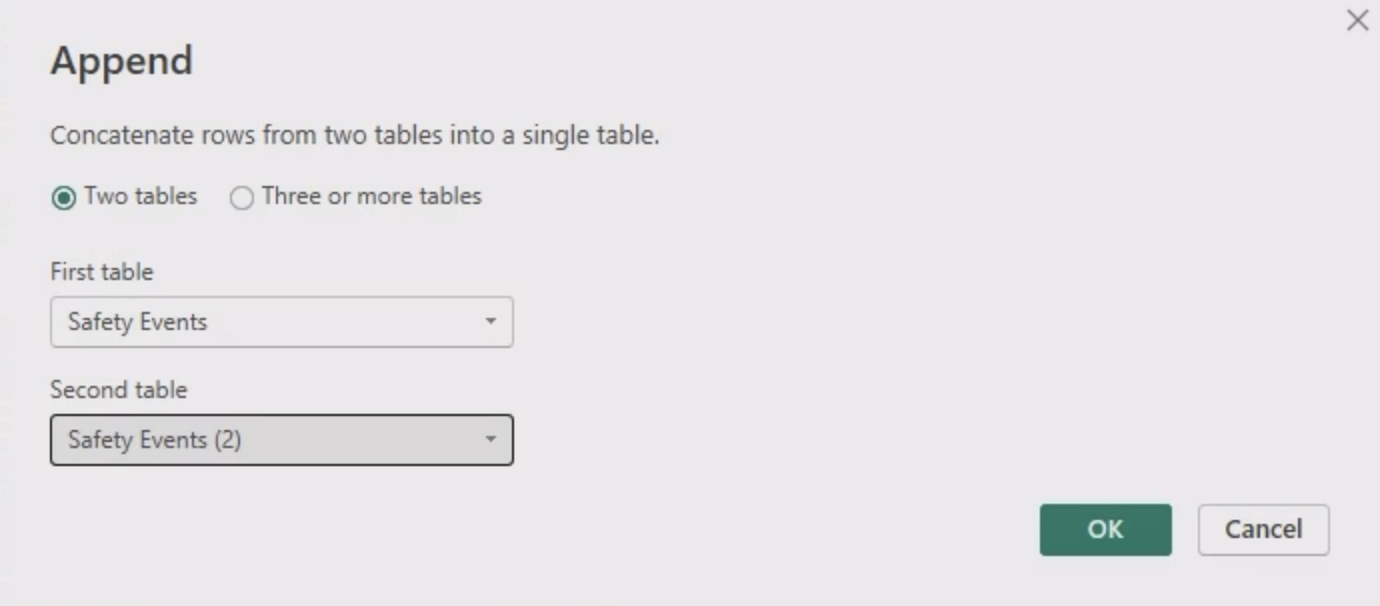
Append Queries as New
Power Query Editor will open. Now select Combine from the tools bar, then Append Queries as New.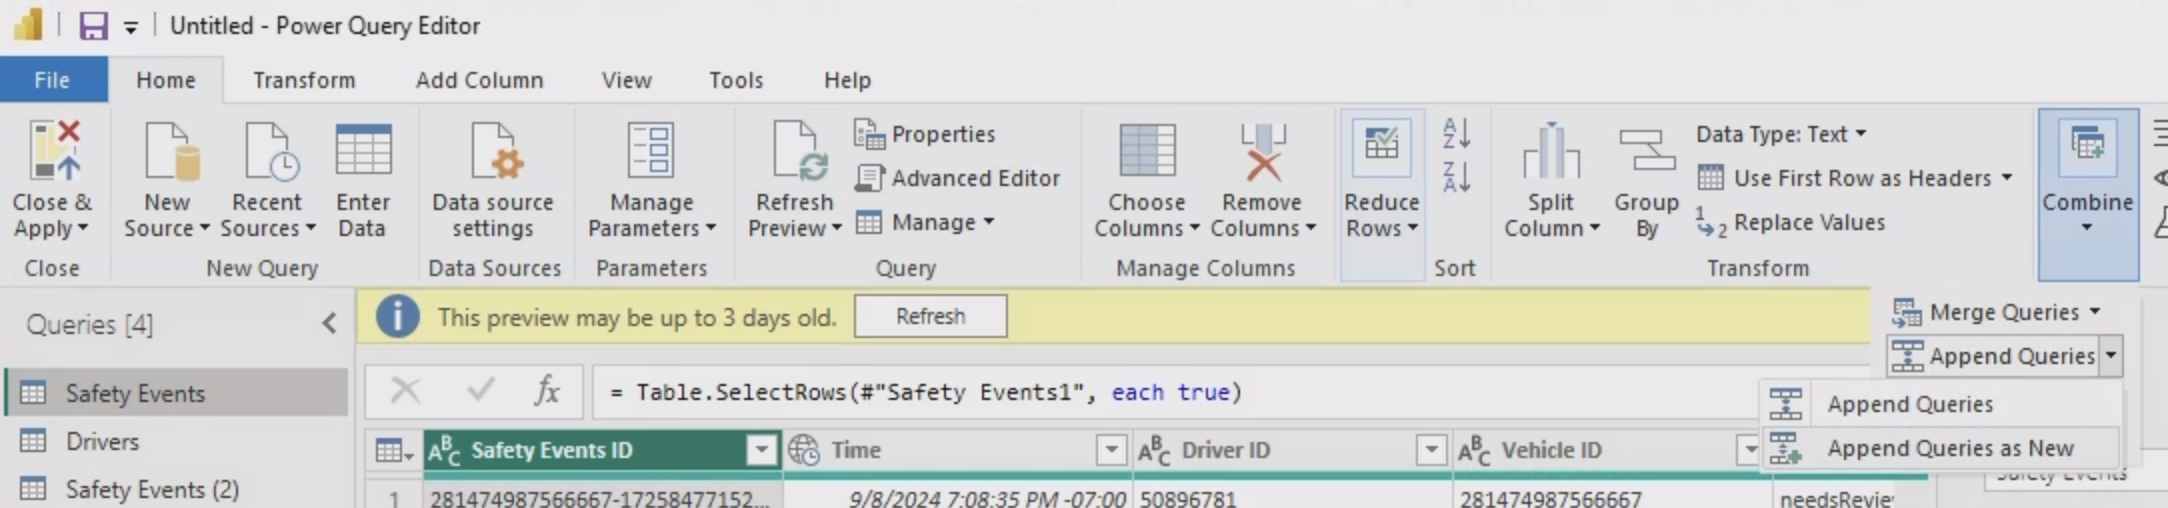
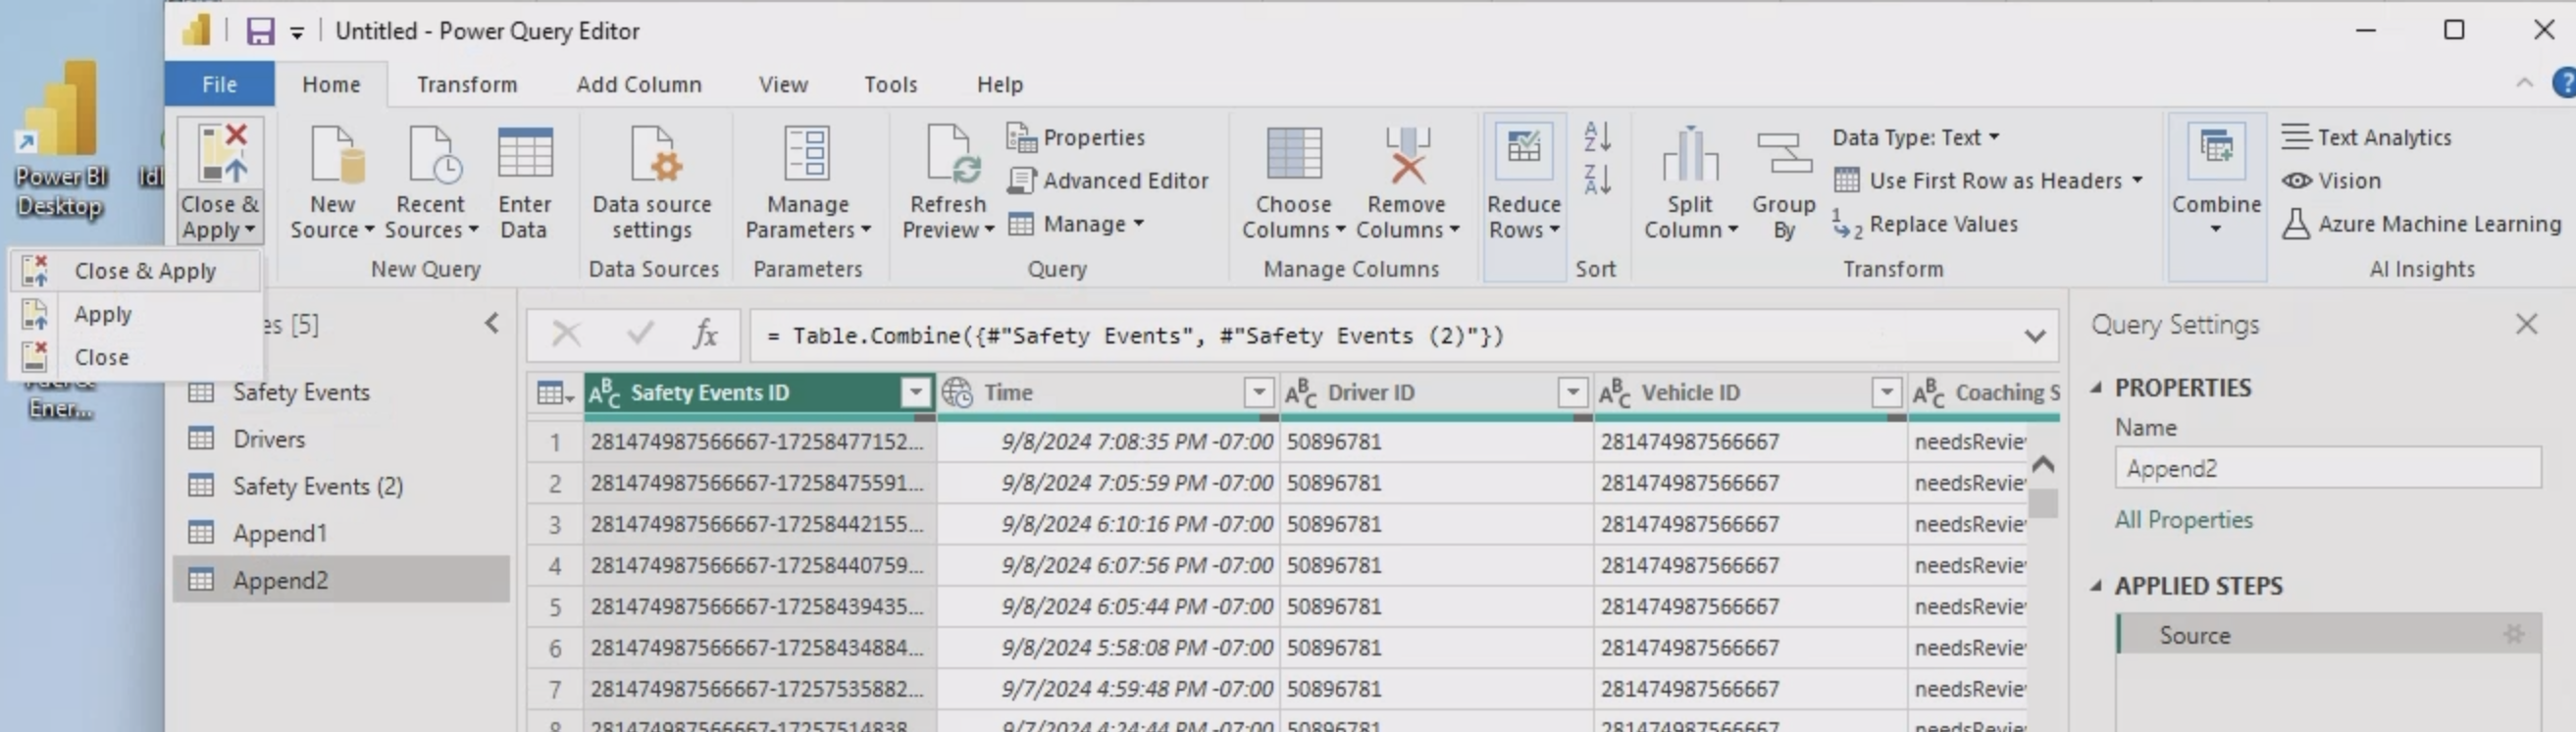
Using M CodeInstead of using the Power Query Editor UI to combine tables you can simply use the table.combine function in M Code. (Notice in the screenshot for Step 5, the output of the UI workflow is a
table.combine.)Connect data for >1 organization
If you manage >1 Samsara organization but want to consolidate analysis in a single Power BI dashboard, we recommend connecting to each organization using PowerQuery Dataflows. Guidance on how to connect to your Samsara data via dataflows is provided in the Product Guide.First organization
Create a dataflow connection for your first organization, giving it a unique name (e.g. include Samsara org ID).
Second organization
Create another dataflow for Samsara with a unique name, with the API token generated for the second organization.
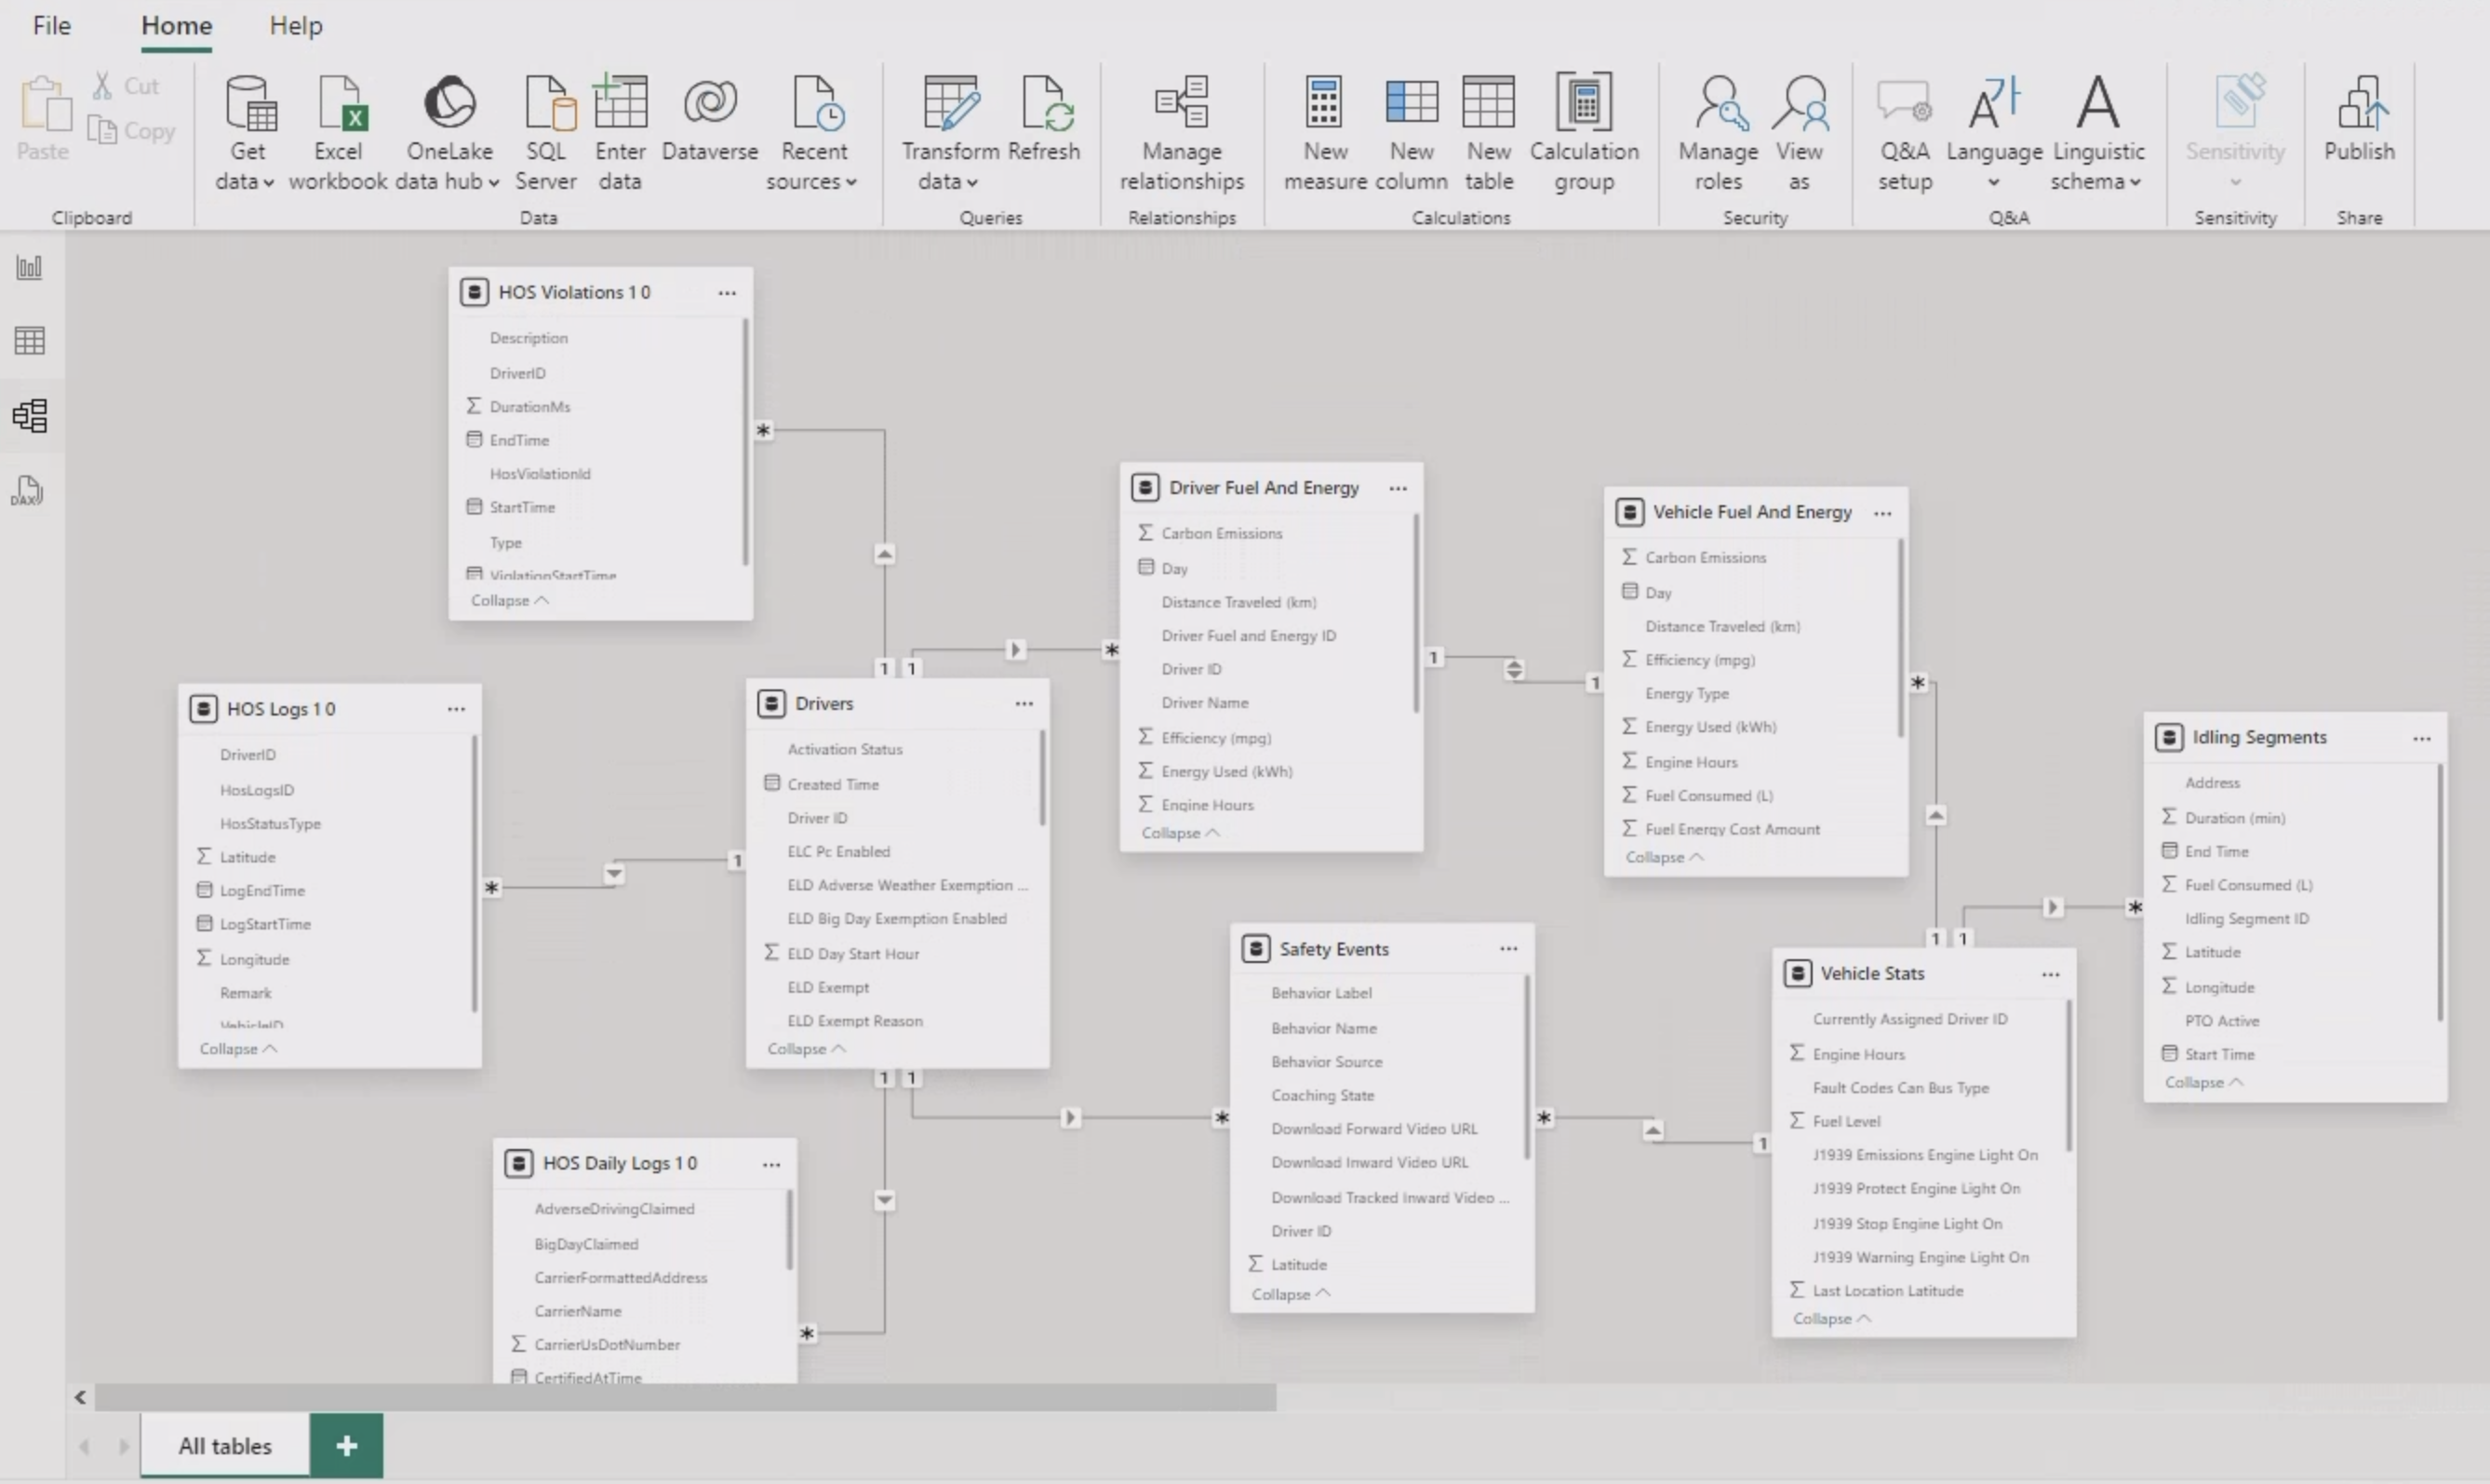
Assign field relationships in Model View
- To view the relationship between entities in each table, open “Model View” in Power BI (follow Microsoft’s guidance here). While tables are in beta, some relationships may need to be manually assigned.
- Click “Manage relationships” under “Home” to review existing relationships and add new ones.
- For fields like “Tags” and “Attributes” you may want to revisit default cardinality settings, depending on your modeling goals.